About Me
 As a Data Analyst, I am passionate
about utilizing data to tackle complex business challenges.
With over 8 years of combined experience in HR analytics,
manufacturing, and supply chain, I have developed a skill
set in identifying areas for optimization and efficiency
improvements that help organizations meet their objectives.
As a Data Analyst, I am passionate
about utilizing data to tackle complex business challenges.
With over 8 years of combined experience in HR analytics,
manufacturing, and supply chain, I have developed a skill
set in identifying areas for optimization and efficiency
improvements that help organizations meet their objectives.
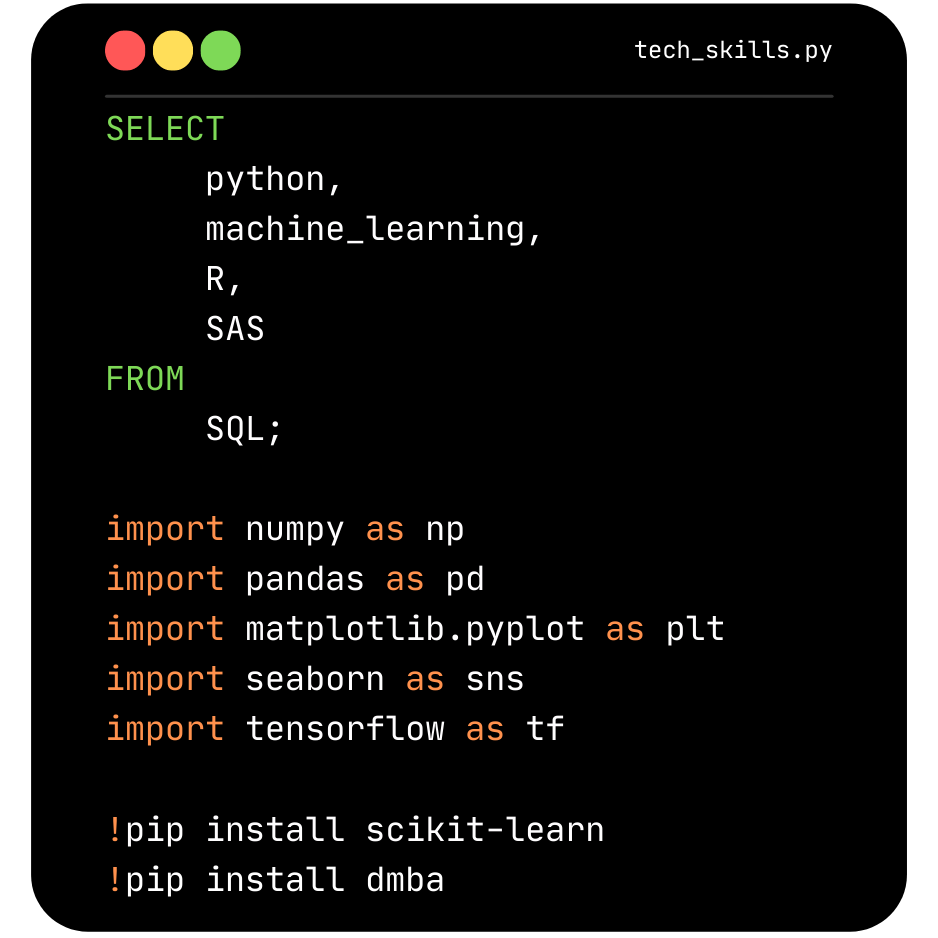
My proficiency in various technical tools and programming
languages, such as Python, Machine Learning, R, SQL, SAS,
MS Excel, Looker, Tableau, and PowerBI, enables me to effectively
analyze and interpret complex data sets, recognize patterns and trends,
and provide practical insights that guide companies towards data-driven decisions.
I firmly believe that there is no such thing as best, that there is always a better way to
accomplish things. Utilizing my proficiency in industrial engineering and data analytics,
I look forward to help your business thrive.
-
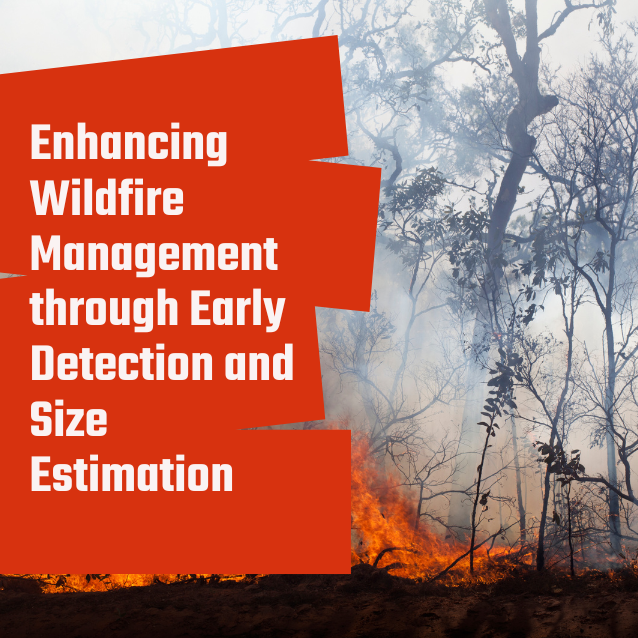
Enhancing Wildfire Management through Early Detection and Size Estimation - Capstone Project
This project which I completed for my capstone in Business Analytics and Insights program at Centennial College, Toronto, ON. This study's main focus is on predicting the potential size of wildfires in the Alberta province. This comprehensive study explores different aspects of wildfire behaviour with the goal of creating prediction models that can precisely anticipate the size of fires, providing crucial information for the management and prevention of wildfires in the Alberta area. (Feel free to email me for access). -
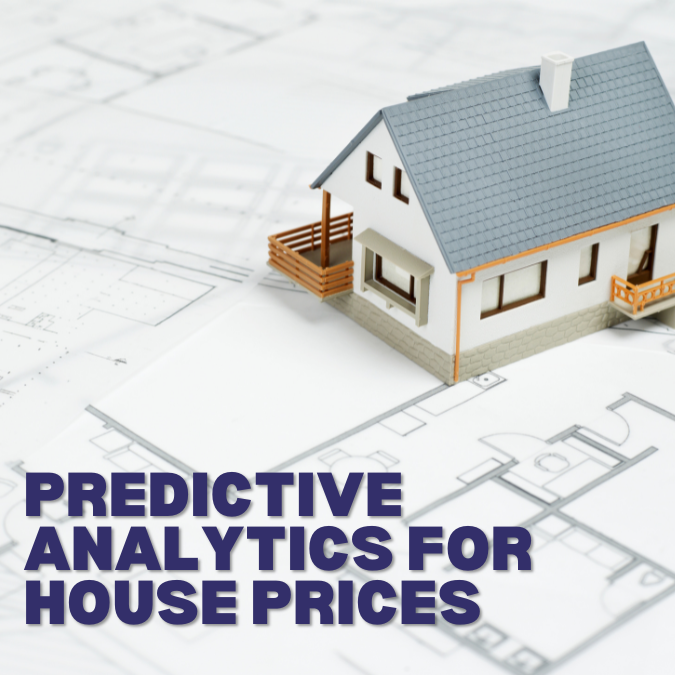
Predictive Analytics for House Prices
This study uses machine learning, to predict the median house prices based on information such as crime rate, pollution, and number of rooms. The dataset contains 13 predictors, and the outcome variable is the median house price (MEDV). -

HR Analytics: Job Change Prediction of Data Scientists
This project's main objective is to create a predictive model that accurately predicts the possibility that a data scientist would change employment. The model will also pinpoint the crucial aspects that affect a candidate's decision to change jobs. In order to do this, data on variables like job happiness, wage, work location, industry, and firm size will be gathered and examined. Patterns and correlations between the variables will then be found using statistical methods like regression analysis and machine learning algorithms. -
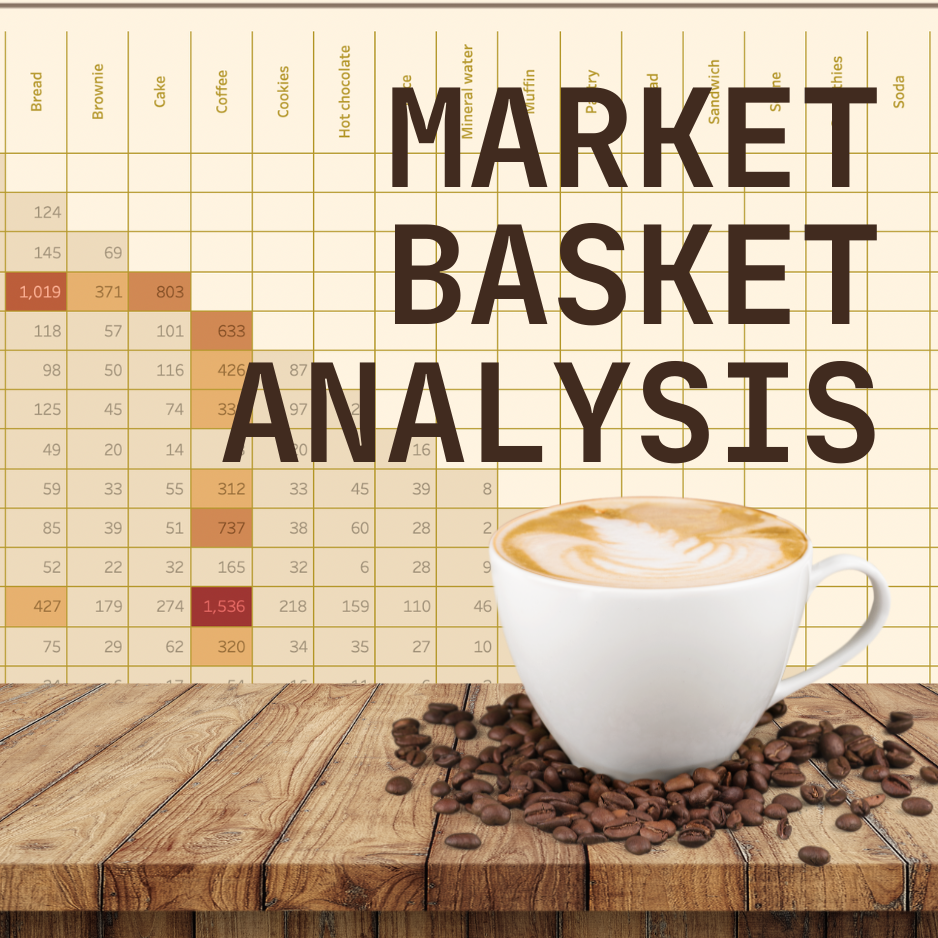
Market Basket Analysis Dashboard - Tableau
This dashboard created in Tableau is designed to provide a visual representation of the market basket analysis for a small coffee shop. It presents the most commonly purchased items together, which can be used to inform marketing and merchandising decisions. This dashboard, can be used to gain insights into customer behavior and preferences, and adjust their offerings accordingly to increase sales and improve customer satisfaction. -

Game Consoles Dashboard - Looker Studio
The "Best Selling Video Games Console of All Time" dashboard created in Looker Studio is a comprehensive and informative display of data that highlights the popularity and success of one of the most iconic gaming consoles ever made. This dashboard provides users with a detailed overview of the console's based on the number of unit solds.
Highlighted Projects
Skills and Interests
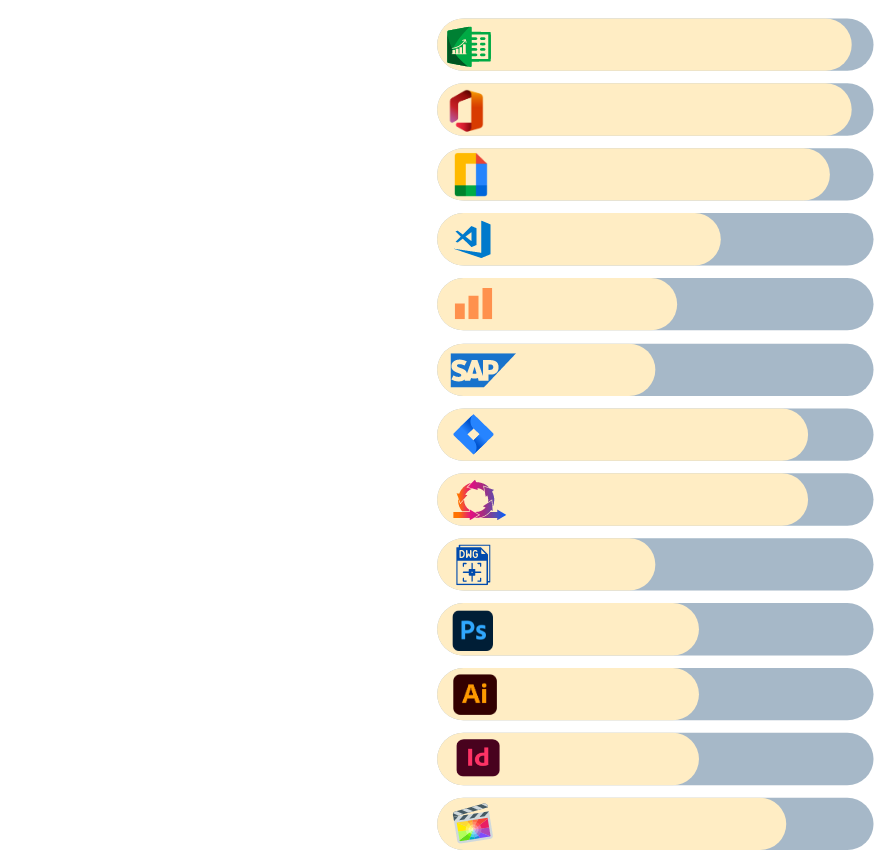
Technical
Data Visualization Tools
Others
Interest and Hobbies
Certificates and Recognitions
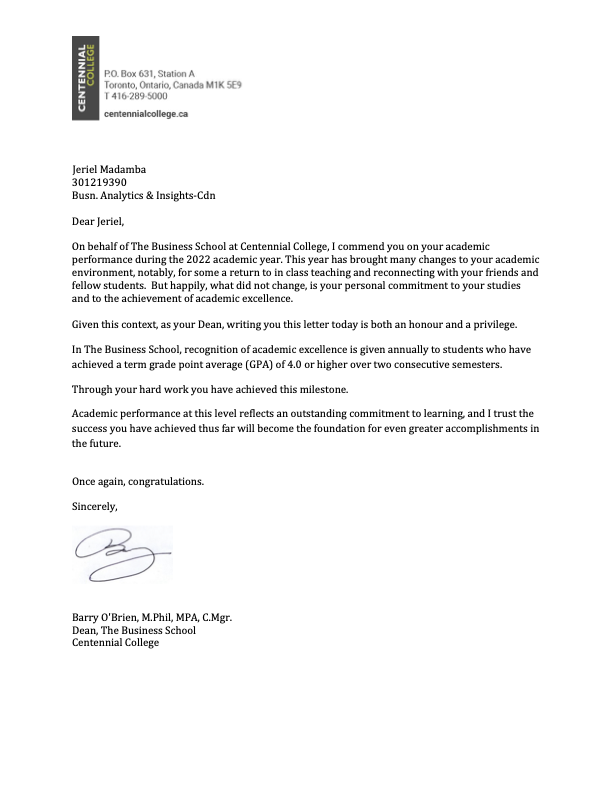 Academic Recognition - Centennial College
 Google Data Analytics
 Modern Big Data Analysis with SQL Specialization
 Project Management Principles and Practices Specialization
 Data Visualization with Tableau Specialization
 Python for Everybody Specialization
 Excel Skills for Business Specialization
 IBM Data Science
 Lean Six Sigma Green Belt


Experience
Part-time Data Analyst
MIDDLEBY CORPORATION, Toronto, ON, 09/2022 - presentData Scientist
PENBROTHERS, Philippines, 05/2021 - 06/2022Data Analyst | Supply Chain Analyst
INDEPENDENT CONTRACTOR, Remote, 04/2017 – 05/2021Part-time University Instructor – Industrial Engineering
SOUTHERN LUZON STATE UNIVERSITY, Philippines, 02/2018 – 12/2018Manufacturing / Product Engineer
EPSON PRECISION PHILIPPINES INCORPORATED, Philippines, 03/2015 – 03/2017Cold Drink Equipment Analyst
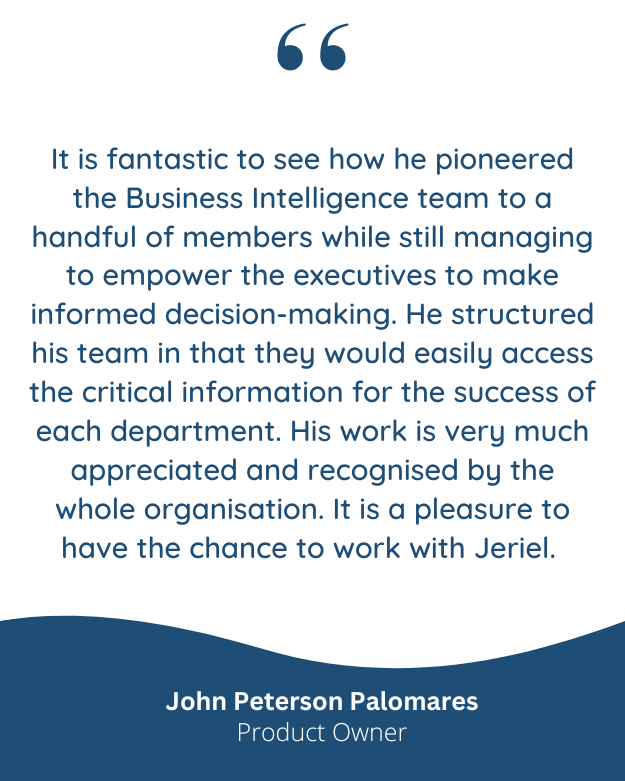
COCA COLA BEVERAGES PHILIPPINES INCORPORATED., Philippines, 08/2014 – 11/2014Testimonials
Contact
- Address: Toronto, ON
- Email: jerielmadamba@gmail.com
- Website: jerielmadamba.github.io
-
Social